I took video clips of me making a taco dinner and put them together with effects I learned to use while messing around with the software. I also didn't use any sound in this video as there was to much background noise. The effects I used in the video are fast blur, sharpen, and change color. My plan was to give it the feel of an old silent film that give you the feel that your not entirely at what is being seen but can make out a few things.

INMS-A 399 Artist and New Media (Fall 2012) Student Work
Thursday, December 13, 2012

Thursday, December 6, 2012
Wednesday, December 5, 2012
Final Glitching
I chose to use glitch art in my final project shown in these gifs. I tried to use what can occur while watching tv on a basic televison and sometimes cable depending on your subscription how you can have a perfect clear screen during your program and then cut out on you during the most crucial of moments. The second one deals with the same scenario except in online gameplay. I used a screenshot of my gameplay of halo. Like tv in the middle of online game you can experince lag which is what the second gif represents. Even with the best of connections you can experince lag and just like tv it to can happen at the crucial of times of gameplay.


Monday, December 3, 2012
Multianxia
This is my final project for the A399 The Artist and New Media class. Initially, I chose the topic of Anxiety and the medium of Cinemagraphy for my study. After further investigation and consultation, I proposed a study of physiological manifestations of Anxiety and a series of Cinemagraphs. Through various trials and errors, I found that physiological manifestations of Anxiety do not lend themselves to the Cinemagraphic medium; the changes in the "filmed body" were consistently too great to function as a Cinemagraph and the represented concepts were also vague at best. The final form of this project ended with the creation of a series of four Cinemagraphs (and this short composite film) that capture physical manifestaion of specific Anxieties that many people may suffer from. Below are the indiviual Cinemagraphs:

Acidohormeanxia - Anxiety brought on by acid shock

Belonetrypanoanxia - Anxiety brought on by needle injection

Coulrofoniasoanxia - Anxiety brought on by killer clowns
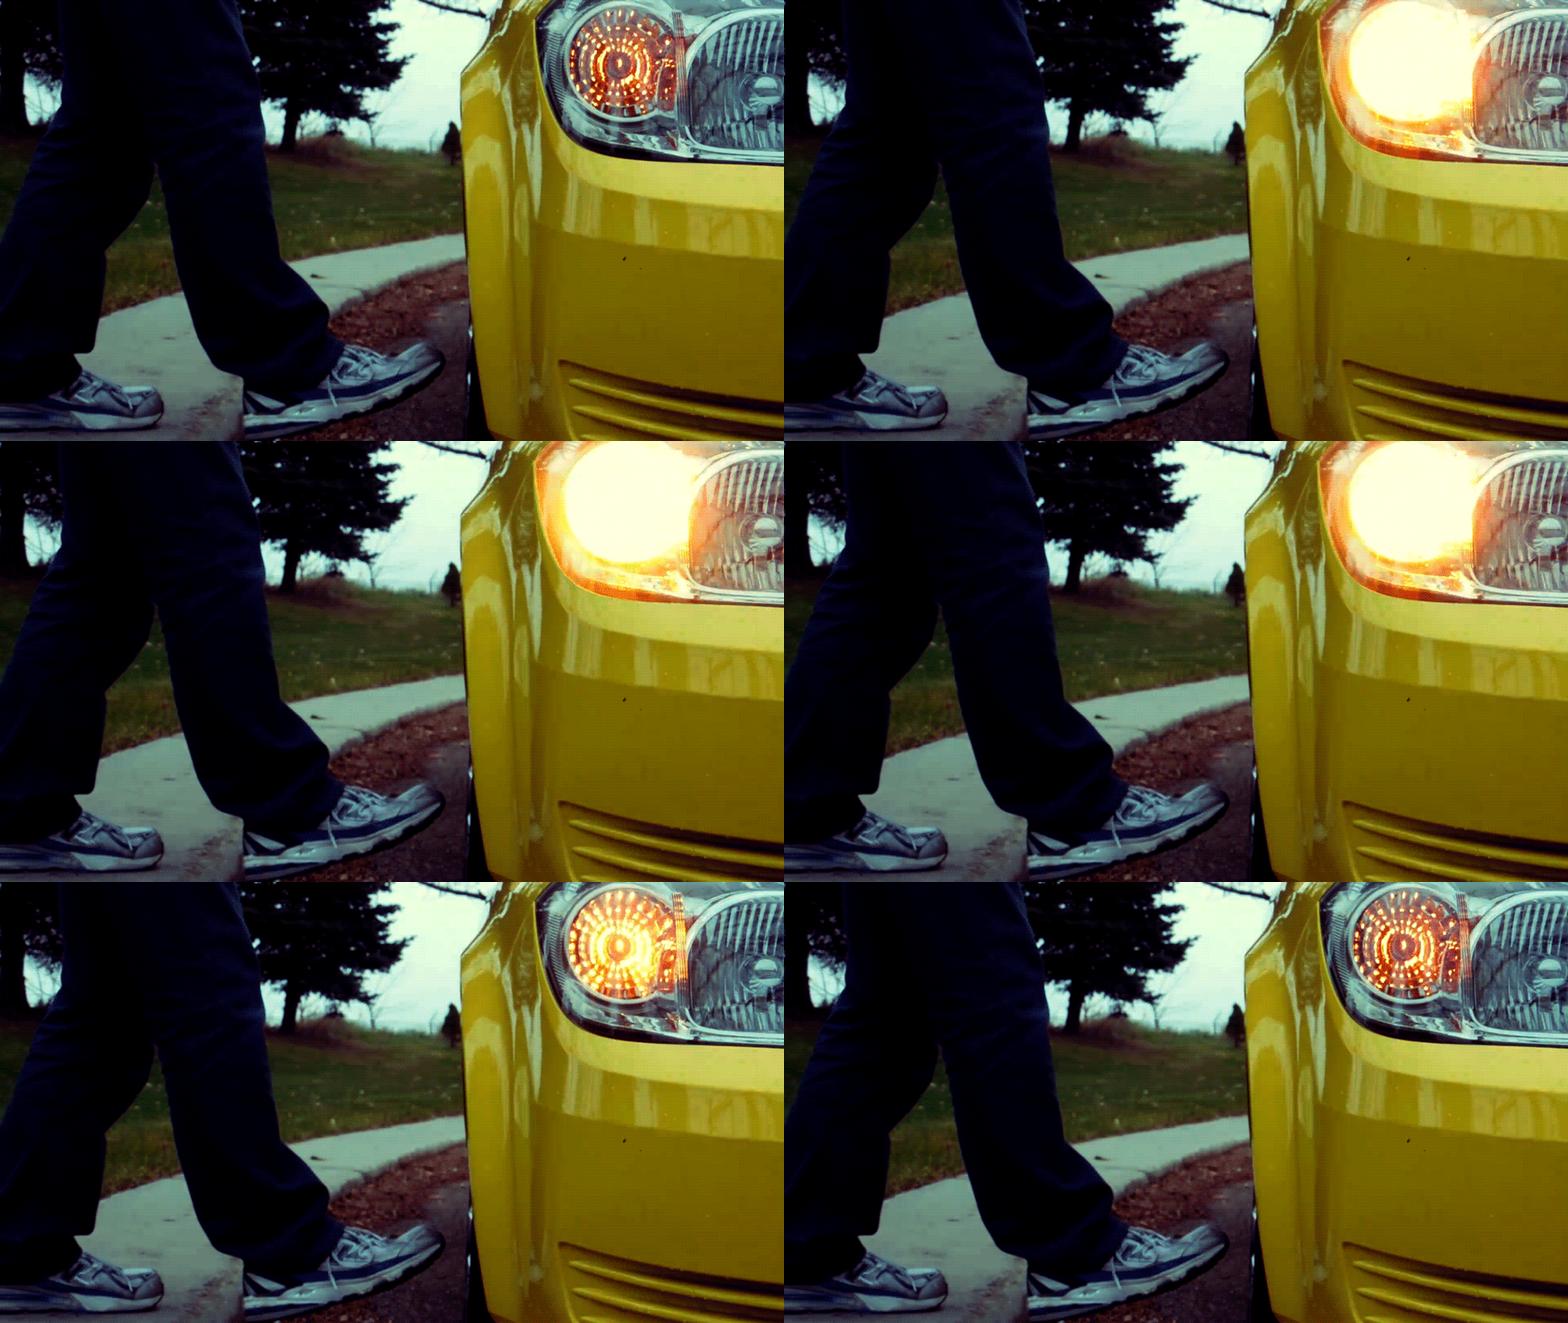
Ochotraumatoanxia - Anxiety brought on by vehicular accidents
artist statement for final
My webpage is on my flash drive, but here is my artist statement for it:
For this project I explored the topic of ‘mind wandering’. Almost everyone’s mind wanders, whether we
notice it or not. It usually takes place when we are doing frequently performed
tasks or something that isn’t very interesting to us. What happens is an area
of our brains flips into a default mode, and in this default mode we think
about things that may have happened in our past or things we want to happen
now, or in the future. This occurrence in people is something that no one has
really found a definitive reasoning for yet, the ambiguity and possibility of
it all is what interests me.
With this piece I wanted to make the experience a personal
one. So the video clips used were taken at places I have noticed my own mind
wandering to. Some of them are very literal, such as the clips at the lake, a
place I would frequently go to walk my dog, or hang out with my friends, but
some of the clips are meant to possess more of a feeling, rather than a
specific place.
The clips of the
cemetery and the counting of coins are examples of this. The cemetery because
we are human and as such, our lives are temporary, so I sometimes catch my mind
wandering to thoughts about what actually happens once we die, and occasionally
to things that were once in my life, but no longer are; The coin clips are to
symbolize how I frequently catch my mind wandering off to thoughts of money. “How
much money will be on this upcoming paycheck? How much money am I going to have
left after I pay my rent this month? I need a job that pays more money.” Etc.
The photos in the background on the site are all ones that
my mind also wanders to mainly because I have all good memories of these
places, people, or things.
The setup of the site is meant to be pretty simple. On the
homepage I have a quote from an article on mind wandering that I really
enjoyed. On the second page I have the clips in my own perspective, as well as
if someone else were seeing them happen. I did this because when our minds
wander they can do so in both of these perspectives. Sometimes we are watching ourselves in situations, or
sometimes we are actually living the situation as it replays.
The photos have
lower opacity because I wanted the photos to be a secondary focus. The clips
are all on auto play because like a wandering mind, it starts on its own, and I
wanted them all playing at the same time over and over because since our mind
goes into its own default mode sometimes the thoughts can be sporadic or mixed
with other thoughts at the same time.
Color and Behavior on Youtube videos
For this project I used Youtube videos to illustrate the use of Color and behavior, of Youtube videos. I choose videos that illustrated behaviors and matched them up with the colors that the behavior would illustrate.
youtubebehaviorcolor2 from Tao Hoang on Vimeo.
Insomnia Art Project
insomnia3 from Michael Nespo on Vimeo.
For this project I decided to focus on the disorder of insomnia because I have been struggling with it myself for the past year. I have also always wanted to make a stop animation film "Robot Chicken" style, so I decided to try it for this project. I made the bedroom diorama from an old ibook box i found in the basement.Sunday, December 2, 2012
In The Dark
In The Dark from Mark Sniadecki on Vimeo.
In tenebrism, light defies our conventional understanding of its physics. The artist paints only choice elements of his subjects with light, and it is not even traditional illumination, but a disembodied source that hides out of view. There are, however, places in reality where this sort of unreal vision can occur--the most alien of places, the depths. Against the deep black of outer space, or far below the ocean's surface where sunlight fails, we get this kind of lighting. And it is in such a location that I have chosen to set my little diorama of the birth, life, and death of an enigmatic form that I've simply been calling "the nodule." The piece passes in a series of brief epochs, each with its own accompanying fauna. Due to the extreme dimness it is best viewed in a completely dark room.
Tuesday, November 27, 2012
Hope for the Homeless

The Hope Rescue Mission in South Bend


Safe Station, Lincoln Way, South Bend. Open near 24 hours to provide a safe place for youth.


Bridge near public Transpo station, a site where refuge can be taken from inclement weather.

Extreme poverty and destruction is a leading cause that drives people to homelessness.


2006- Counted 560 people living in shelters and 93 homeless people who weren't living in a shelter.
Shelter's do not have the capacity to house and assist all of those in need. Many turn to alternative means of shelter, such as 24 hour emergency rooms, public transportation sites and covered locations out of doors.
Tuesday, November 6, 2012
Monday, November 5, 2012

data project
For this project i wanted to do something that involves myself. And i wanted it to make sense. So i decided i do a data project that reflects the existence of myself within an info graphics theme towards this world. I wanted this project to be simple and decided to do it in illustrator. I wanted the format to be linear and geometric within this poster like theme.


thurs-sun activities
Here's the original data I collected from thursday thru sunday about some of the activities I do everyday (in no particular order).
Some averages of
daily activities in four days
Average
number of times I hit the snooze button: 2.75
Average
number of times I used the toaster: 0.25 times per day
Average
number of hours spent driving: .028
Average
number of times I brushed my teeth: once per day
Average
number of hours spent on my laptop: 0.1666
Average
number of gallons of gas bought: 2.0925
Average
number of hours spent watching T.V.: 0.225
Average
number of minutes spent using my cell phone: none!
Average
number of hours in school: 0.0625
Average
number of hours working: 0.19791
Here's the video I made on this data:
Infographics - Calling
This is my infographics project for A399. I collected data of all the phone calls I
received over the course of a week. I
want to make this piece reflect the timing to scale and identify the caller via
an emotional color space.
In After
Effects, I created an animated abstracted representation of a clock figure to
illustrate the passing of time to scale.
All of my calls were collected during a roughly 12 segment of a 24 hour
day, so I let one rotation of the clock (which takes one minute) represent one
day (12 hour segment). Since I wanted to
be as precise as I could, I used a 60 fps format. All of the heavy math aside, 12 seconds of
call time equals 1/60th of a second in my piece... or an hour of real time
equals one minute in my piece... whichever helps you visualize better.
So, I took my clockwork composition
and brought it into a Premiere composition.
From there, I cued my keyframes to the call times and insert the
corresponding color space to the call from the person who was on the other end
of the line. (I created the abstract
color spaces in Photoshop and made a different piece for each of my 7 contacts
based on my emotional reaction to each of them individually.) I then adjusted the duration of display of the
color space to match each individual call length.
From a reflective stand point, I'm
a bit of a teeter-tot on this piece. I
like it's precision and I love the emotional color spaces I created, but the
down side to the precision is that it reflects the amount of time I spend off
of the phone, which results in A LOT of blank space, and the scale I had to use
made the color spaces into quick blips that really depreciate the impact that a
longer exposure to each would have. So,
it's a tradeoff. Meh.
In my initial stages, I tried
making the color spaces into color space rays that would maintain on the clock
and let them build up over the days, but my for one, my After Effects aptitude
isn't quite up to that level, and two, even when I just made a faux placeholder
ray to mimic the effect, it didn't hold enough space to be anything more than a
thin line of color since my calls were so relatively short. I also felt that that suspension really
fought against the flow of time and that the overlay, while an interesting
concept, would be misleading or confusing.
So, that issue solved itself... woo hoo.
24hours?
[Resubmitted Video]
For my project, I recorded my interaction with technology over a 24 hour period. Using a plain background, I reenacted the action to piece them together and came to the realization that there is very little time that I don't have technology.
Power On/Off
I used the data I found to make a gift in the form of the power button we see every day. I used the power buttons to form a small city and tried to show the power buttons going on and off thoughout the day. I also used the colors to highlight when something was on or turned on and those colors are purple, green, and blue.


Life Timer (Unfinished)
Life Timer WIP from Mark Sniadecki on Vimeo.
This is a work in progress. The data
illustrated here are the hours I spent working and in classes beginning
December 1st, 2010. In addition to the format seen here, I am intending
to add something like cut-scenes for events like major holidays or
semester starting points. I am also planning to go back and add some
textual messages in the lower righthand corner (opposite the calendar
bar) that will make comments upon particularly busy or slow passages in
the data.
Unfortunately, the idea for this piece came to me late in the game... so I will have to finish it and re-submit after the assignment deadline.
Credits: The graphics are completely my own. The opening theme music is by Eric Skiff, who offers up his 8-bit compositions freely for projects like this at ericskiff.com/music/ All other audio is my own creation.
Subscribe to:
Posts (Atom)